Multi-Platform Monitoring
Monitor SaaS service status, incidents, and performance metrics with comprehensive tracking and historical data analysis.
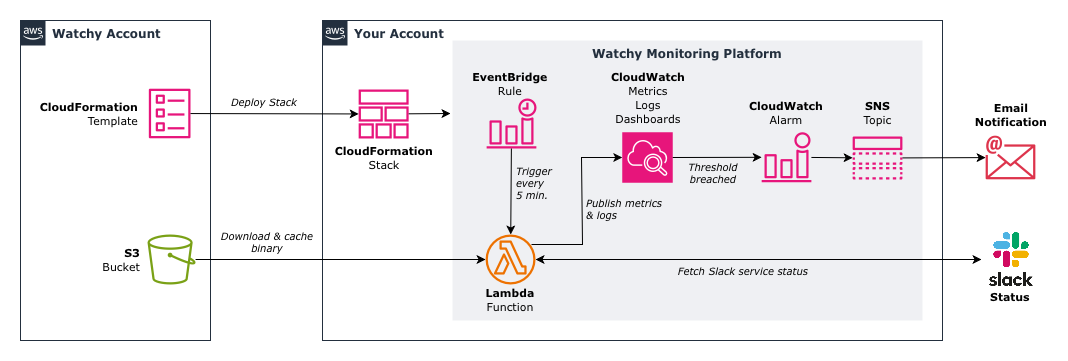
Monitor SaaS apps with Amazon CloudWatch
🚀 Deploy AWS CloudFormationaws cloudformation create-stack --stack-name watchy-platform --template-url https://watchy-resources.s3.us-east-1.amazonaws.com/watchy-platform.yaml --capabilities CAPABILITY_IAM
Deploy comprehensive, open source SaaS monitoring in your AWS account with a CloudFormation stack. Monitor SaaS status, incidents, and log messages with native CloudWatch integration.
Complete serverless monitoring infrastructure
Real-time monitoring dashboards
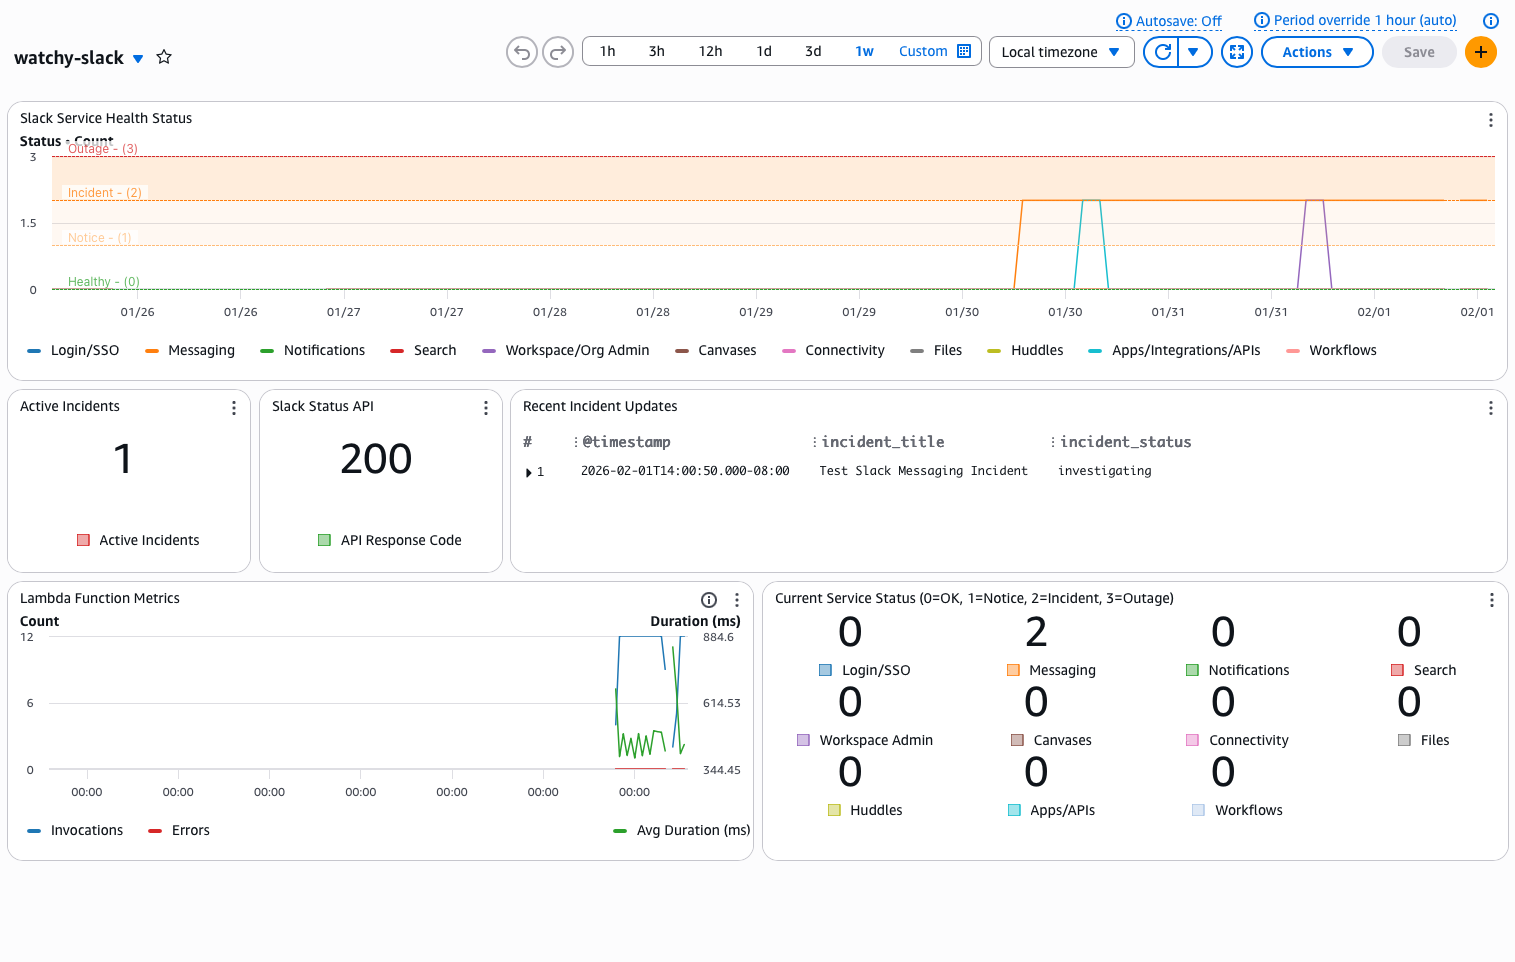
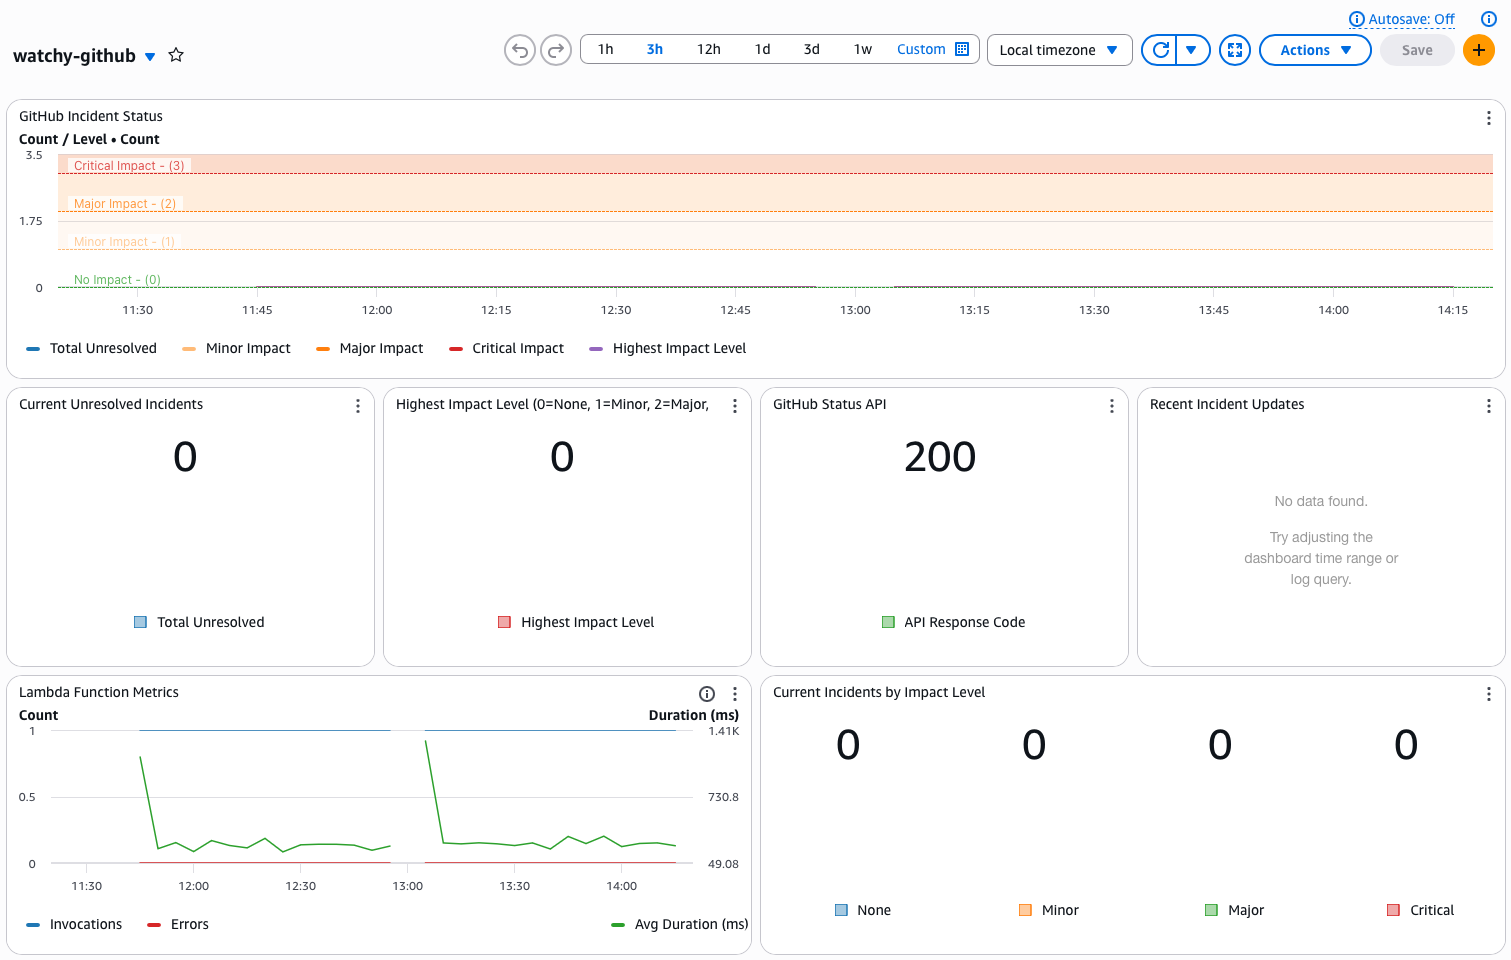
Monitor SaaS service status, incidents, and performance metrics with comprehensive tracking and historical data analysis.
Built-in AWS CloudWatch metrics, logs, and dashboards with automated alerting for service degradations and incidents across both platforms.
5-minute polling intervals with instant notifications for both SaaS status changes, incidents, and performance degradations.
SNS notifications via email with CloudWatch alarms for service degradations, incidents, and API response issues.
Complete CloudFormation deployment with Lambda functions, IAM roles, CloudWatch resources, and SNS topics configured automatically.
~$18 USD per month of AWS resource costs. Includes Slack monitoring (~$10), GitHub monitoring (~$7), and core platform (~$1).
Comprehensive monitoring resources for Slack and GitHub with detailed CloudWatch integration
watchy-slack-monitor Core monitoring
watchy-github-monitor Core monitoring
ActiveIncidents Current active incidents countAPIResponse API response time and statusAppsIntegrationsAPIs Apps/Integrations/APIs healthCanvases Canvases feature statusConnectivity Overall connectivity statusFiles File sharing service statusHuddles Huddles feature statusLoginSSO Login/SSO service statusMessaging Core messaging service statusNotifications Notification service statusSearch Search functionality statusWorkflows Workflows feature statusWorkspaceOrgAdministration Admin features statusAPIResponseTime Status API response time (ms)ComponentStatus Individual component healthIncidentCount Unresolved incidents countIncidentImpact Service impact level (1-5)ServiceStatus Overall service health (0=down, 1=up)ActiveIncidents No alarms (monitoring only)APIResponse Threshold: > 200AppsIntegrationsAPIs Threshold: ≥ 2 (incident/outage)Canvases Threshold: ≥ 2 (incident/outage)Connectivity Threshold: ≥ 2 (incident/outage)Files Threshold: ≥ 2 (incident/outage)Huddles Threshold: ≥ 2 (incident/outage)LoginSSO Threshold: ≥ 2 (incident/outage)Messaging Threshold: ≥ 2 (incident/outage)Notifications Threshold: ≥ 2 (incident/outage)Search Threshold: ≥ 2 (incident/outage)Workflows Threshold: ≥ 2 (incident/outage)WorkspaceOrgAdministration Threshold: ≥ 2 (incident/outage)APITimeout Threshold: > 200ComponentFailure Threshold: > 0 (any unresolved incidents)MajorIncident Threshold: > 0 (major impact incidents)MultipleIncidents Threshold: > 0 (critical impact incidents)ServiceDown Threshold: ≥ 2 (major/critical impact)/aws/lambda/watchy-slack-monitor Lambda execution logs/watchy/services/slack Slack incident logswatchy-slack CloudWatch dashboard/aws/lambda/watchy-github-monitor Lambda execution logs/watchy/services/github GitHub incident logswatchy-github CloudWatch dashboardWe can help you design or optimize your AWS monitoring solution.